Trendline Charts 3.98
Free Version
Publisher Description
Trendline Charts - The no non-sense trendline pattern charts and screeners!
**Announcement: Market Data Source has been fixed, v3.86.
Trendline Charts (v3.0) by Screenulator.com ®
What's new on V3.0:
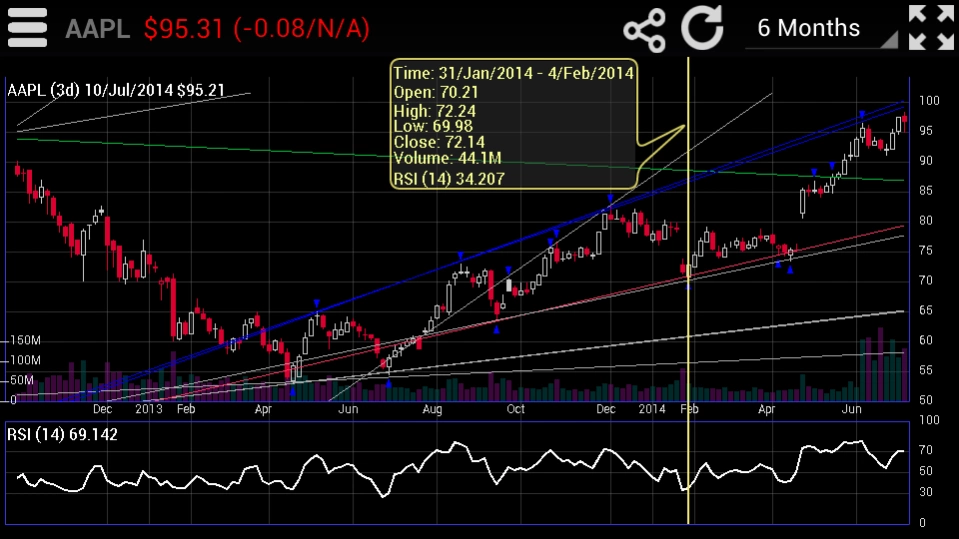
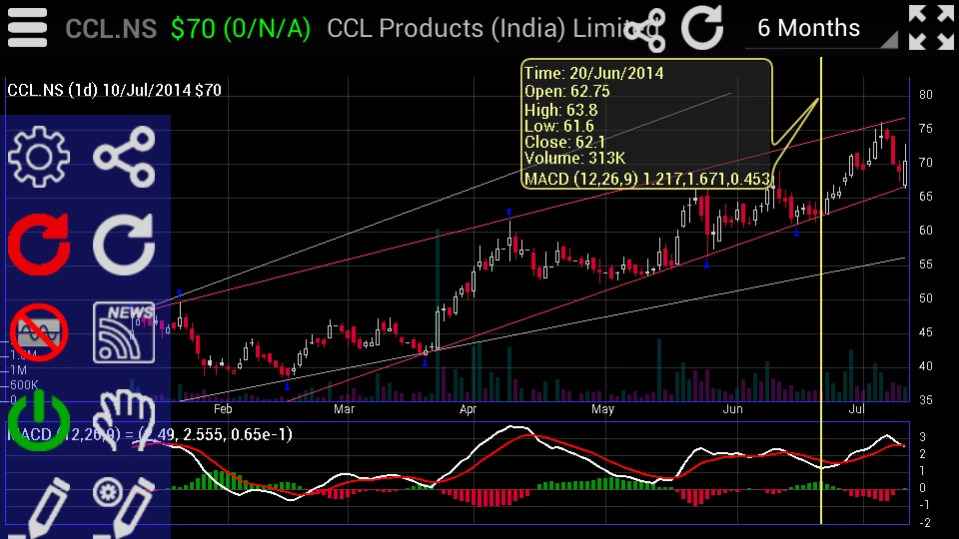
- Interactive Charts, touch info display, scroll, zoom
- Intraday charts and trendlines
- Indicator window: RSI, MACD, SMA, EMA, Bollinger, Keltner, Donchian band, Ichimoku Cloud, Parabolic SAR, McGinley Dynamic, SuperTrend, stochastic, ADX, Aroon, Chaikin, Ultimate, MFI, OBV, ATR, ADL, CCI indicators. Fibonacci Retracement and text annotation tools
- FOREX pairs supported
- RSS News feed
Summary:
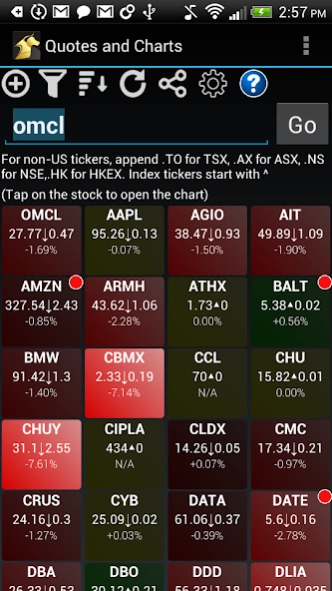
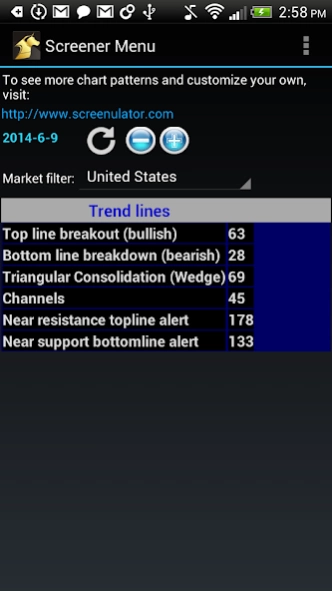
The only stock chart app to automatically display Support and Resistance lines (also known as Trendlines) on a Candlestick chart, powered by Screenulator.com chart pattern recognition AI algorithms. It also has a filter or stock screener based on Trendline patterns, such as Resistance breakout and Support penetration. For example, you can see all the stocks that have broke out resistance levels at a glance.
By using Deep Learning Neural Networks, the effectiveness and profitability of automated trendlines have been backtested with over 50+ years of historical big data.
About Trendlines:
A trend line is a bounding line for the price movement of a security. A support trend line (or a bottom line) is formed when a securities price decreases and then rebounds at a pivot point that aligns with at least two previous support pivot points. Similarly a resistance trend line (or a top line) is formed when a securities price increases and then rebounds at a pivot point that aligns with at least two previous resistance pivot points. In other words, bottom lines are formed by joining a series of bottom points, and top lines are formed by joining a series of peaks.
Trendlines are considered by many expert traders and investors as the single most important tools in technical analysis. However, unlike other indicators of Technical Analysis, it does not come with a fixed formula, but require human eyes and brain to draw the best fit line across a series of bottoms or tops. It is still very much of an art form. If you are looking for a particular trendline pattern - such as Resistance breakout, the tasks of drawing trendlines for all stocks on the market becomes tedious if not impossible. This tool solves the problem for you.
Stock screeners based on trendline patterns include: Resistance (topline) breakout, Support (bottom line) penetration, Channels (both top and bottom line), Wedge (Consolidation pattern bounded by top and bottom lines), near Support level, near Resistance level. The screening results are updated daily and individual stock charts and automatic trendline drawing is done instantaneously in real time.
For non-US tickers, append .TO for TSX, .AX for ASX, .HK for HKEX. Index tickers start with ^
- Candlestick charting for all stocks in 16 markets worldwide, 19000+ symbols
- All Forex pairs
- Supported markets: NASDAQ, NYSE, AMEX, TSX, Asia: HKEX, Australia, New Zealand, India (NSE), JKSE, Shenzhen, Shanghai, Singapore, Europe: London, Paris, Brussels, Amsterdam, Milan, Athens
- Advanced chart pattern recognition engine to display trendlines overlay
- Stock screeners based on trendline patterns, updated daily
- Check out more advanced technical analysis tools at www.Screenulator.com!
Trendline colors: http://www.screenulator.com/cgi-bin/v?pid=faq
Keywords: Stock charts, Trend line, trendlines, automated chart pattern detection
About Trendline Charts
Trendline Charts is a free app for Android published in the Accounting & Finance list of apps, part of Business.
The company that develops Trendline Charts is Screenulator Inc.. The latest version released by its developer is 3.98.
To install Trendline Charts on your Android device, just click the green Continue To App button above to start the installation process. The app is listed on our website since 2020-05-26 and was downloaded 3 times. We have already checked if the download link is safe, however for your own protection we recommend that you scan the downloaded app with your antivirus. Your antivirus may detect the Trendline Charts as malware as malware if the download link to screenulator.com.trendline.charts.free is broken.
How to install Trendline Charts on your Android device:
- Click on the Continue To App button on our website. This will redirect you to Google Play.
- Once the Trendline Charts is shown in the Google Play listing of your Android device, you can start its download and installation. Tap on the Install button located below the search bar and to the right of the app icon.
- A pop-up window with the permissions required by Trendline Charts will be shown. Click on Accept to continue the process.
- Trendline Charts will be downloaded onto your device, displaying a progress. Once the download completes, the installation will start and you'll get a notification after the installation is finished.
